OpenPyXL 3.0.7
  • 教程
  • 简单用法
  • 性能
  • 优化模式
  • 插入和删除行和列,移动单元格范围
  • 操纵 Pandas 和 NumPy
  • 图表
  • 注释
  • 操控样式
  • 额外工作表特性
  • 条件格式化
  • 数据透视表
  • 打印设置
  • 使用过滤器和排序
  • 验证单元格
  • 定义名称
  • 工作表表格
  • 剖析公式
  • 日期和时间
  • 保护
  • 开发
  • openpyxl 包
  • 3.0.7 (2021-03-09)
  • 3.0.6 (2021-01-14)
  • 3.0.5 (2020-08-21)
  • 3.0.4 (2020-06-24)
  • 3.0.3 (2020-01-20)
  • 3.0.2 (2019-11-25)
  • 3.0.1 (2019-11-14)
  • 3.0.0 (2019-09-25)
  • 2.6.4 (2019-09-25)
  • 2.6.3 (2019-08-19)
  • 2.6.2 (2019-03-29)
  • 2.6.1 (2019-03-04)
  • 2.6.0 (2019-02-06)
  • 2.6.-b1 (2019-01-08)
  • 2.6-a1 (2018-11-21)
  • 2.5.14 (2019-01-23)
  • 2.5.13 (brown bag)
  • 2.5.12 (2018-11-29)
  • 2.5.11 (2018-11-21)
  • 2.5.10 (2018-11-13)
  • 2.5.9 (2018-10-19)
  • 2.5.8 (2018-09-25)
  • 2.5.7 (2018-09-13)
  • 2.5.6 (2018-08-30)
  • 2.5.5 (2018-08-04)
  • 2.5.4 (2018-06-07)
  • 2.5.3 (2018-04-18)
  • 2.5.2 (2018-04-06)
  • 2.5.1 (2018-03-12)
  • 2.5.0 (2018-01-24)
  • 2.5.0-b2 (2018-01-19)
  • 2.5.0-b1 (2017-10-19)
  • 2.5.0-a3 (2017-08-14)
  • 2.5.0-a2 (2017-06-25)
  • 2.5.0-a1 (2017-05-30)
  • 2.4.11 (2018-01-24)
  • 2.4.10 (2018-01-19)
  • 2.4.9 (2017-10-19)
  • 2.4.8 (2017-05-30)
  • 2.4.7 (2017-04-24)
  • 2.4.6 (2017-04-14)
  • 2.4.5 (2017-03-07)
  • 2.4.4 (2017-02-23)
  • 2.4.3 (未发行)
  • 2.4.2 (2017-01-31)
  • 2.4.1 (2016-11-23)
  • 2.4.0 (2016-09-15)
  • 2.4.0-b1 (2016-06-08)
  • 2.4.0-a1 (2016-04-11)
  • 2.3.5 (2016-04-11)
  • 2.3.4 (2016-03-16)
  • 2.3.3 (2016-01-18)
  • 2.3.2 (2015-12-07)
  • 2.3.1 (2015-11-20)
  • 2.3.0 (2015-10-20)
  • 2.3.0-b2 (2015-09-04)
  • 2.3.0-b1 (2015-06-29)
  • 2.2.6 (未发行)
  • 2.2.5 (2015-06-29)
  • 2.2.4 (2015-06-17)
  • 2.2.3 (2015-05-26)
  • 2.2.2 (2015-04-28)
  • 2.2.1 (2015-03-31)
  • 2.2.0 (2015-03-11)
  • 2.2.0-b1 (2015-02-18)
  • 2.1.5 (2015-02-18)
  • 2.1.4 (2014-12-16)
  • 2.1.3 (2014-12-09)
  • 2.1.2 (2014-10-23)
  • 2.1.1 (2014-10-08)
  • 2.1.0 (2014-09-21)
  • 2.0.5 (2014-08-08)
  • 2.0.4 (2014-06-25)
  • 2.0.3 (2014-05-22)
  • 2.0.2 (2014-05-13)
  • 2.0.1 (2014-05-13) brown bag
  • 2.0.0 (2014-05-13) brown bag
  • 1.8.6 (2014-05-05)
  • 1.8.5 (2014-03-25)
  • 1.8.4 (2014-02-25)
  • 1.8.3 (2014-02-09)
  • 1.8.2 (2014-01-17)
  • 1.8.1 (2014-01-14)
  • 1.8.0 (2014-01-08)
  • 1.7.0 (2013-10-31)
  • 气泡图表

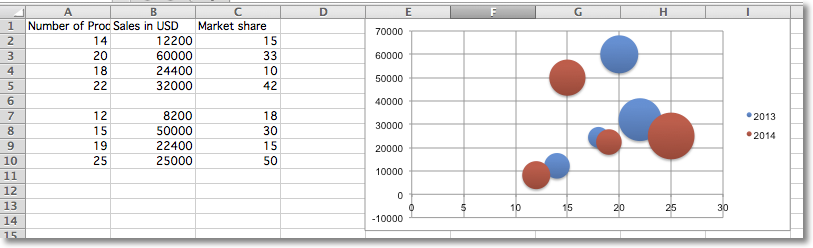
    Bubble charts are similar to scatter charts but use a third dimension to determine the size of the bubbles. Charts can include multiple series.

    """
    Sample bubble chart
    """
    from openpyxl import Workbook
    from openpyxl.chart import Series, Reference, BubbleChart
    wb = Workbook()
    ws = wb.active
    rows = [
        ("Number of Products", "Sales in USD", "Market share"),
        (14, 12200, 15),
        (20, 60000, 33),
        (18, 24400, 10),
        (22, 32000, 42),
        (),
        (12, 8200, 18),
        (15, 50000, 30),
        (19, 22400, 15),
        (25, 25000, 50),
    ]
    for row in rows:
        ws.append(row)
    chart = BubbleChart()
    chart.style = 18 # use a preset style
    # add the first series of data
    xvalues = Reference(ws, min_col=1, min_row=2, max_row=5)
    yvalues = Reference(ws, min_col=2, min_row=2, max_row=5)
    size = Reference(ws, min_col=3, min_row=2, max_row=5)
    series = Series(values=yvalues, xvalues=xvalues, zvalues=size, title="2013")
    chart.series.append(series)
    # add the second
    xvalues = Reference(ws, min_col=1, min_row=7, max_row=10)
    yvalues = Reference(ws, min_col=2, min_row=7, max_row=10)
    size = Reference(ws, min_col=3, min_row=7, max_row=10)
    series = Series(values=yvalues, xvalues=xvalues, zvalues=size, title="2014")
    chart.series.append(series)
    # place the chart starting in cell E1
    ws.add_chart(chart, "E1")
    wb.save("bubble.xlsx")
    					

    This will produce a bubble chart with two series and should look something like this:

    "Sample bubble chart"