OpenPyXL 3.0.7
  • 教程
  • 简单用法
  • 性能
  • 优化模式
  • 插入和删除行和列,移动单元格范围
  • 操纵 Pandas 和 NumPy
  • 图表
  • 注释
  • 操控样式
  • 额外工作表特性
  • 条件格式化
  • 数据透视表
  • 打印设置
  • 使用过滤器和排序
  • 验证单元格
  • 定义名称
  • 工作表表格
  • 剖析公式
  • 日期和时间
  • 保护
  • 开发
  • openpyxl 包
  • 3.0.7 (2021-03-09)
  • 3.0.6 (2021-01-14)
  • 3.0.5 (2020-08-21)
  • 3.0.4 (2020-06-24)
  • 3.0.3 (2020-01-20)
  • 3.0.2 (2019-11-25)
  • 3.0.1 (2019-11-14)
  • 3.0.0 (2019-09-25)
  • 2.6.4 (2019-09-25)
  • 2.6.3 (2019-08-19)
  • 2.6.2 (2019-03-29)
  • 2.6.1 (2019-03-04)
  • 2.6.0 (2019-02-06)
  • 2.6.-b1 (2019-01-08)
  • 2.6-a1 (2018-11-21)
  • 2.5.14 (2019-01-23)
  • 2.5.13 (brown bag)
  • 2.5.12 (2018-11-29)
  • 2.5.11 (2018-11-21)
  • 2.5.10 (2018-11-13)
  • 2.5.9 (2018-10-19)
  • 2.5.8 (2018-09-25)
  • 2.5.7 (2018-09-13)
  • 2.5.6 (2018-08-30)
  • 2.5.5 (2018-08-04)
  • 2.5.4 (2018-06-07)
  • 2.5.3 (2018-04-18)
  • 2.5.2 (2018-04-06)
  • 2.5.1 (2018-03-12)
  • 2.5.0 (2018-01-24)
  • 2.5.0-b2 (2018-01-19)
  • 2.5.0-b1 (2017-10-19)
  • 2.5.0-a3 (2017-08-14)
  • 2.5.0-a2 (2017-06-25)
  • 2.5.0-a1 (2017-05-30)
  • 2.4.11 (2018-01-24)
  • 2.4.10 (2018-01-19)
  • 2.4.9 (2017-10-19)
  • 2.4.8 (2017-05-30)
  • 2.4.7 (2017-04-24)
  • 2.4.6 (2017-04-14)
  • 2.4.5 (2017-03-07)
  • 2.4.4 (2017-02-23)
  • 2.4.3 (未发行)
  • 2.4.2 (2017-01-31)
  • 2.4.1 (2016-11-23)
  • 2.4.0 (2016-09-15)
  • 2.4.0-b1 (2016-06-08)
  • 2.4.0-a1 (2016-04-11)
  • 2.3.5 (2016-04-11)
  • 2.3.4 (2016-03-16)
  • 2.3.3 (2016-01-18)
  • 2.3.2 (2015-12-07)
  • 2.3.1 (2015-11-20)
  • 2.3.0 (2015-10-20)
  • 2.3.0-b2 (2015-09-04)
  • 2.3.0-b1 (2015-06-29)
  • 2.2.6 (未发行)
  • 2.2.5 (2015-06-29)
  • 2.2.4 (2015-06-17)
  • 2.2.3 (2015-05-26)
  • 2.2.2 (2015-04-28)
  • 2.2.1 (2015-03-31)
  • 2.2.0 (2015-03-11)
  • 2.2.0-b1 (2015-02-18)
  • 2.1.5 (2015-02-18)
  • 2.1.4 (2014-12-16)
  • 2.1.3 (2014-12-09)
  • 2.1.2 (2014-10-23)
  • 2.1.1 (2014-10-08)
  • 2.1.0 (2014-09-21)
  • 2.0.5 (2014-08-08)
  • 2.0.4 (2014-06-25)
  • 2.0.3 (2014-05-22)
  • 2.0.2 (2014-05-13)
  • 2.0.1 (2014-05-13) brown bag
  • 2.0.0 (2014-05-13) brown bag
  • 1.8.6 (2014-05-05)
  • 1.8.5 (2014-03-25)
  • 1.8.4 (2014-02-25)
  • 1.8.3 (2014-02-09)
  • 1.8.2 (2014-01-17)
  • 1.8.1 (2014-01-14)
  • 1.8.0 (2014-01-08)
  • 1.7.0 (2013-10-31)
  • 雷达图表

    Data that is arranged in columns or rows on a worksheet can be plotted in a radar chart. Radar charts compare the aggregate values of multiple data series. It is effectively a projection of an area chart on a circular x-axis.

    There are two types of radar chart: standard, where the area is marked with a line; and filled, where the whole area is filled. The additional type “marker” has no effect. If markers are desired these can be set for the relevant series.

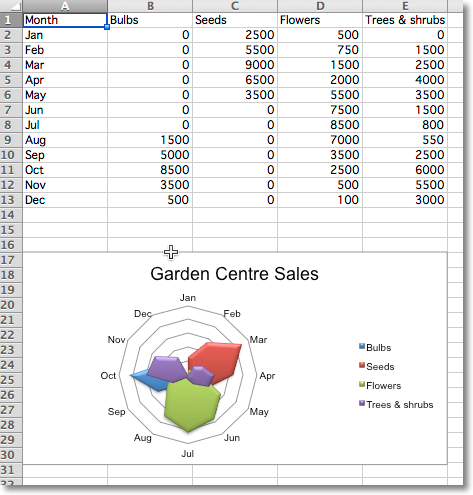
    from openpyxl import Workbook
    from openpyxl.chart import (
        RadarChart,
        Reference,
    )
    wb = Workbook()
    ws = wb.active
    rows = [
        ['Month', "Bulbs", "Seeds", "Flowers", "Trees & shrubs"],
        ['Jan', 0, 2500, 500, 0,],
        ['Feb', 0, 5500, 750, 1500],
        ['Mar', 0, 9000, 1500, 2500],
        ['Apr', 0, 6500, 2000, 4000],
        ['May', 0, 3500, 5500, 3500],
        ['Jun', 0, 0, 7500, 1500],
        ['Jul', 0, 0, 8500, 800],
        ['Aug', 1500, 0, 7000, 550],
        ['Sep', 5000, 0, 3500, 2500],
        ['Oct', 8500, 0, 2500, 6000],
        ['Nov', 3500, 0, 500, 5500],
        ['Dec', 500, 0, 100, 3000 ],
    ]
    for row in rows:
        ws.append(row)
    chart = RadarChart()
    chart.type = "filled"
    labels = Reference(ws, min_col=1, min_row=2, max_row=13)
    data = Reference(ws, min_col=2, max_col=5, min_row=1, max_row=13)
    chart.add_data(data, titles_from_data=True)
    chart.set_categories(labels)
    chart.style = 26
    chart.title = "Garden Centre Sales"
    chart.y_axis.delete = True
    ws.add_chart(chart, "A17")
    wb.save("radar.xlsx")
    					
    "Sample radar chart"