OpenPyXL 3.0.7
  • 教程
  • 简单用法
  • 性能
  • 优化模式
  • 插入和删除行和列,移动单元格范围
  • 操纵 Pandas 和 NumPy
  • 图表
  • 注释
  • 操控样式
  • 额外工作表特性
  • 条件格式化
  • 数据透视表
  • 打印设置
  • 使用过滤器和排序
  • 验证单元格
  • 定义名称
  • 工作表表格
  • 剖析公式
  • 日期和时间
  • 保护
  • 开发
  • openpyxl 包
  • 3.0.7 (2021-03-09)
  • 3.0.6 (2021-01-14)
  • 3.0.5 (2020-08-21)
  • 3.0.4 (2020-06-24)
  • 3.0.3 (2020-01-20)
  • 3.0.2 (2019-11-25)
  • 3.0.1 (2019-11-14)
  • 3.0.0 (2019-09-25)
  • 2.6.4 (2019-09-25)
  • 2.6.3 (2019-08-19)
  • 2.6.2 (2019-03-29)
  • 2.6.1 (2019-03-04)
  • 2.6.0 (2019-02-06)
  • 2.6.-b1 (2019-01-08)
  • 2.6-a1 (2018-11-21)
  • 2.5.14 (2019-01-23)
  • 2.5.13 (brown bag)
  • 2.5.12 (2018-11-29)
  • 2.5.11 (2018-11-21)
  • 2.5.10 (2018-11-13)
  • 2.5.9 (2018-10-19)
  • 2.5.8 (2018-09-25)
  • 2.5.7 (2018-09-13)
  • 2.5.6 (2018-08-30)
  • 2.5.5 (2018-08-04)
  • 2.5.4 (2018-06-07)
  • 2.5.3 (2018-04-18)
  • 2.5.2 (2018-04-06)
  • 2.5.1 (2018-03-12)
  • 2.5.0 (2018-01-24)
  • 2.5.0-b2 (2018-01-19)
  • 2.5.0-b1 (2017-10-19)
  • 2.5.0-a3 (2017-08-14)
  • 2.5.0-a2 (2017-06-25)
  • 2.5.0-a1 (2017-05-30)
  • 2.4.11 (2018-01-24)
  • 2.4.10 (2018-01-19)
  • 2.4.9 (2017-10-19)
  • 2.4.8 (2017-05-30)
  • 2.4.7 (2017-04-24)
  • 2.4.6 (2017-04-14)
  • 2.4.5 (2017-03-07)
  • 2.4.4 (2017-02-23)
  • 2.4.3 (未发行)
  • 2.4.2 (2017-01-31)
  • 2.4.1 (2016-11-23)
  • 2.4.0 (2016-09-15)
  • 2.4.0-b1 (2016-06-08)
  • 2.4.0-a1 (2016-04-11)
  • 2.3.5 (2016-04-11)
  • 2.3.4 (2016-03-16)
  • 2.3.3 (2016-01-18)
  • 2.3.2 (2015-12-07)
  • 2.3.1 (2015-11-20)
  • 2.3.0 (2015-10-20)
  • 2.3.0-b2 (2015-09-04)
  • 2.3.0-b1 (2015-06-29)
  • 2.2.6 (未发行)
  • 2.2.5 (2015-06-29)
  • 2.2.4 (2015-06-17)
  • 2.2.3 (2015-05-26)
  • 2.2.2 (2015-04-28)
  • 2.2.1 (2015-03-31)
  • 2.2.0 (2015-03-11)
  • 2.2.0-b1 (2015-02-18)
  • 2.1.5 (2015-02-18)
  • 2.1.4 (2014-12-16)
  • 2.1.3 (2014-12-09)
  • 2.1.2 (2014-10-23)
  • 2.1.1 (2014-10-08)
  • 2.1.0 (2014-09-21)
  • 2.0.5 (2014-08-08)
  • 2.0.4 (2014-06-25)
  • 2.0.3 (2014-05-22)
  • 2.0.2 (2014-05-13)
  • 2.0.1 (2014-05-13) brown bag
  • 2.0.0 (2014-05-13) brown bag
  • 1.8.6 (2014-05-05)
  • 1.8.5 (2014-03-25)
  • 1.8.4 (2014-02-25)
  • 1.8.3 (2014-02-09)
  • 1.8.2 (2014-01-17)
  • 1.8.1 (2014-01-14)
  • 1.8.0 (2014-01-08)
  • 1.7.0 (2013-10-31)
  • 散点图表

    Scatter, or xy, charts are similar to some line charts. The main difference is that one series of values is plotted against another. This is useful where values are unordered.

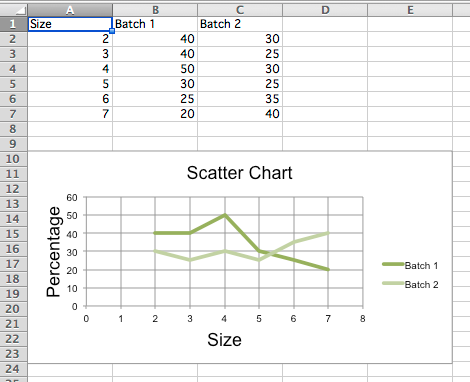
    from openpyxl import Workbook
    from openpyxl.chart import (
        ScatterChart,
        Reference,
        Series,
    )
    wb = Workbook()
    ws = wb.active
    rows = [
        ['Size', 'Batch 1', 'Batch 2'],
        [2, 40, 30],
        [3, 40, 25],
        [4, 50, 30],
        [5, 30, 25],
        [6, 25, 35],
        [7, 20, 40],
    ]
    for row in rows:
        ws.append(row)
    chart = ScatterChart()
    chart.title = "Scatter Chart"
    chart.style = 13
    chart.x_axis.title = 'Size'
    chart.y_axis.title = 'Percentage'
    xvalues = Reference(ws, min_col=1, min_row=2, max_row=7)
    for i in range(2, 4):
        values = Reference(ws, min_col=i, min_row=1, max_row=7)
        series = Series(values, xvalues, title_from_data=True)
        chart.series.append(series)
    ws.add_chart(chart, "A10")
    wb.save("scatter.xlsx")
    					
    "Sample scatter chart"

    注意

    The specification says that there are the following types of scatter charts: ‘line’, ‘lineMarker’, ‘marker’, ‘smooth’, ‘smoothMarker’. However, at least in Microsoft Excel, this is just a shortcut for other settings that otherwise have no effect. For consistency with line charts, the style for each series should be set manually.